Engineering Design Smart Energy Challenge
2025-10-24
Getting top 4 in a university challenge, with a wireless power meter
For my second semester in my second year at university, we had a electronics design course where we had to make a power meter for a fictional power source and load: a 14V RMS sinewave oscillating at 500Hz, with a load that varied from 2.5 to 7.5VA. We were given an ATMega328P clocked at 2MHz along with a ESP32 for wifi capability (optional, but I was 9000% gonna get my team to do the challenge). We also needed to achieve a 5% accuracy, with less than accurate components...
The analog bit
We couldn't just send the 14V RMS straight into the ATMega, as that would not be very good for it,
so we needed to reduce the voltage and create a sensing circuit so that we could measure it. we used
a voltage divider to reduce the voltage to about 2V RMS. We also needed to measure the current draw from
the load, which was done by measuring the voltage across a shunt resistor, we used a 0.5 Ohm resistor for
this.
Since we can't have a voltage that goes below zero feed into the ADC, we also need to shift the signal.
This was done with a opamp and a 2.1V reference voltage, the 2.1V reference relied on the 5V regulator to
be a decently accurate 5V, which while fine at the time without the display, would prove to be less than
reliable later on...
There was a couple of filters that were added in to reduce any noise from the connected voltage source
(which was present). We also had a couple zero crossing detectors for the voltage and current signals
coming in.
The Digital bit
For the ATMega328P, we pretty much copied the design from the datasheet. we used a 16MHz crystal divided
in software by 8 to get the 2MHz which is as fast as we were allowed to go :( The ESP32 was given as a
development board, which meant all we needed to connect was the serial line. A resistor divider was needed
for this as we can't have the 5V serial signal going into the 3.3V ESP32.
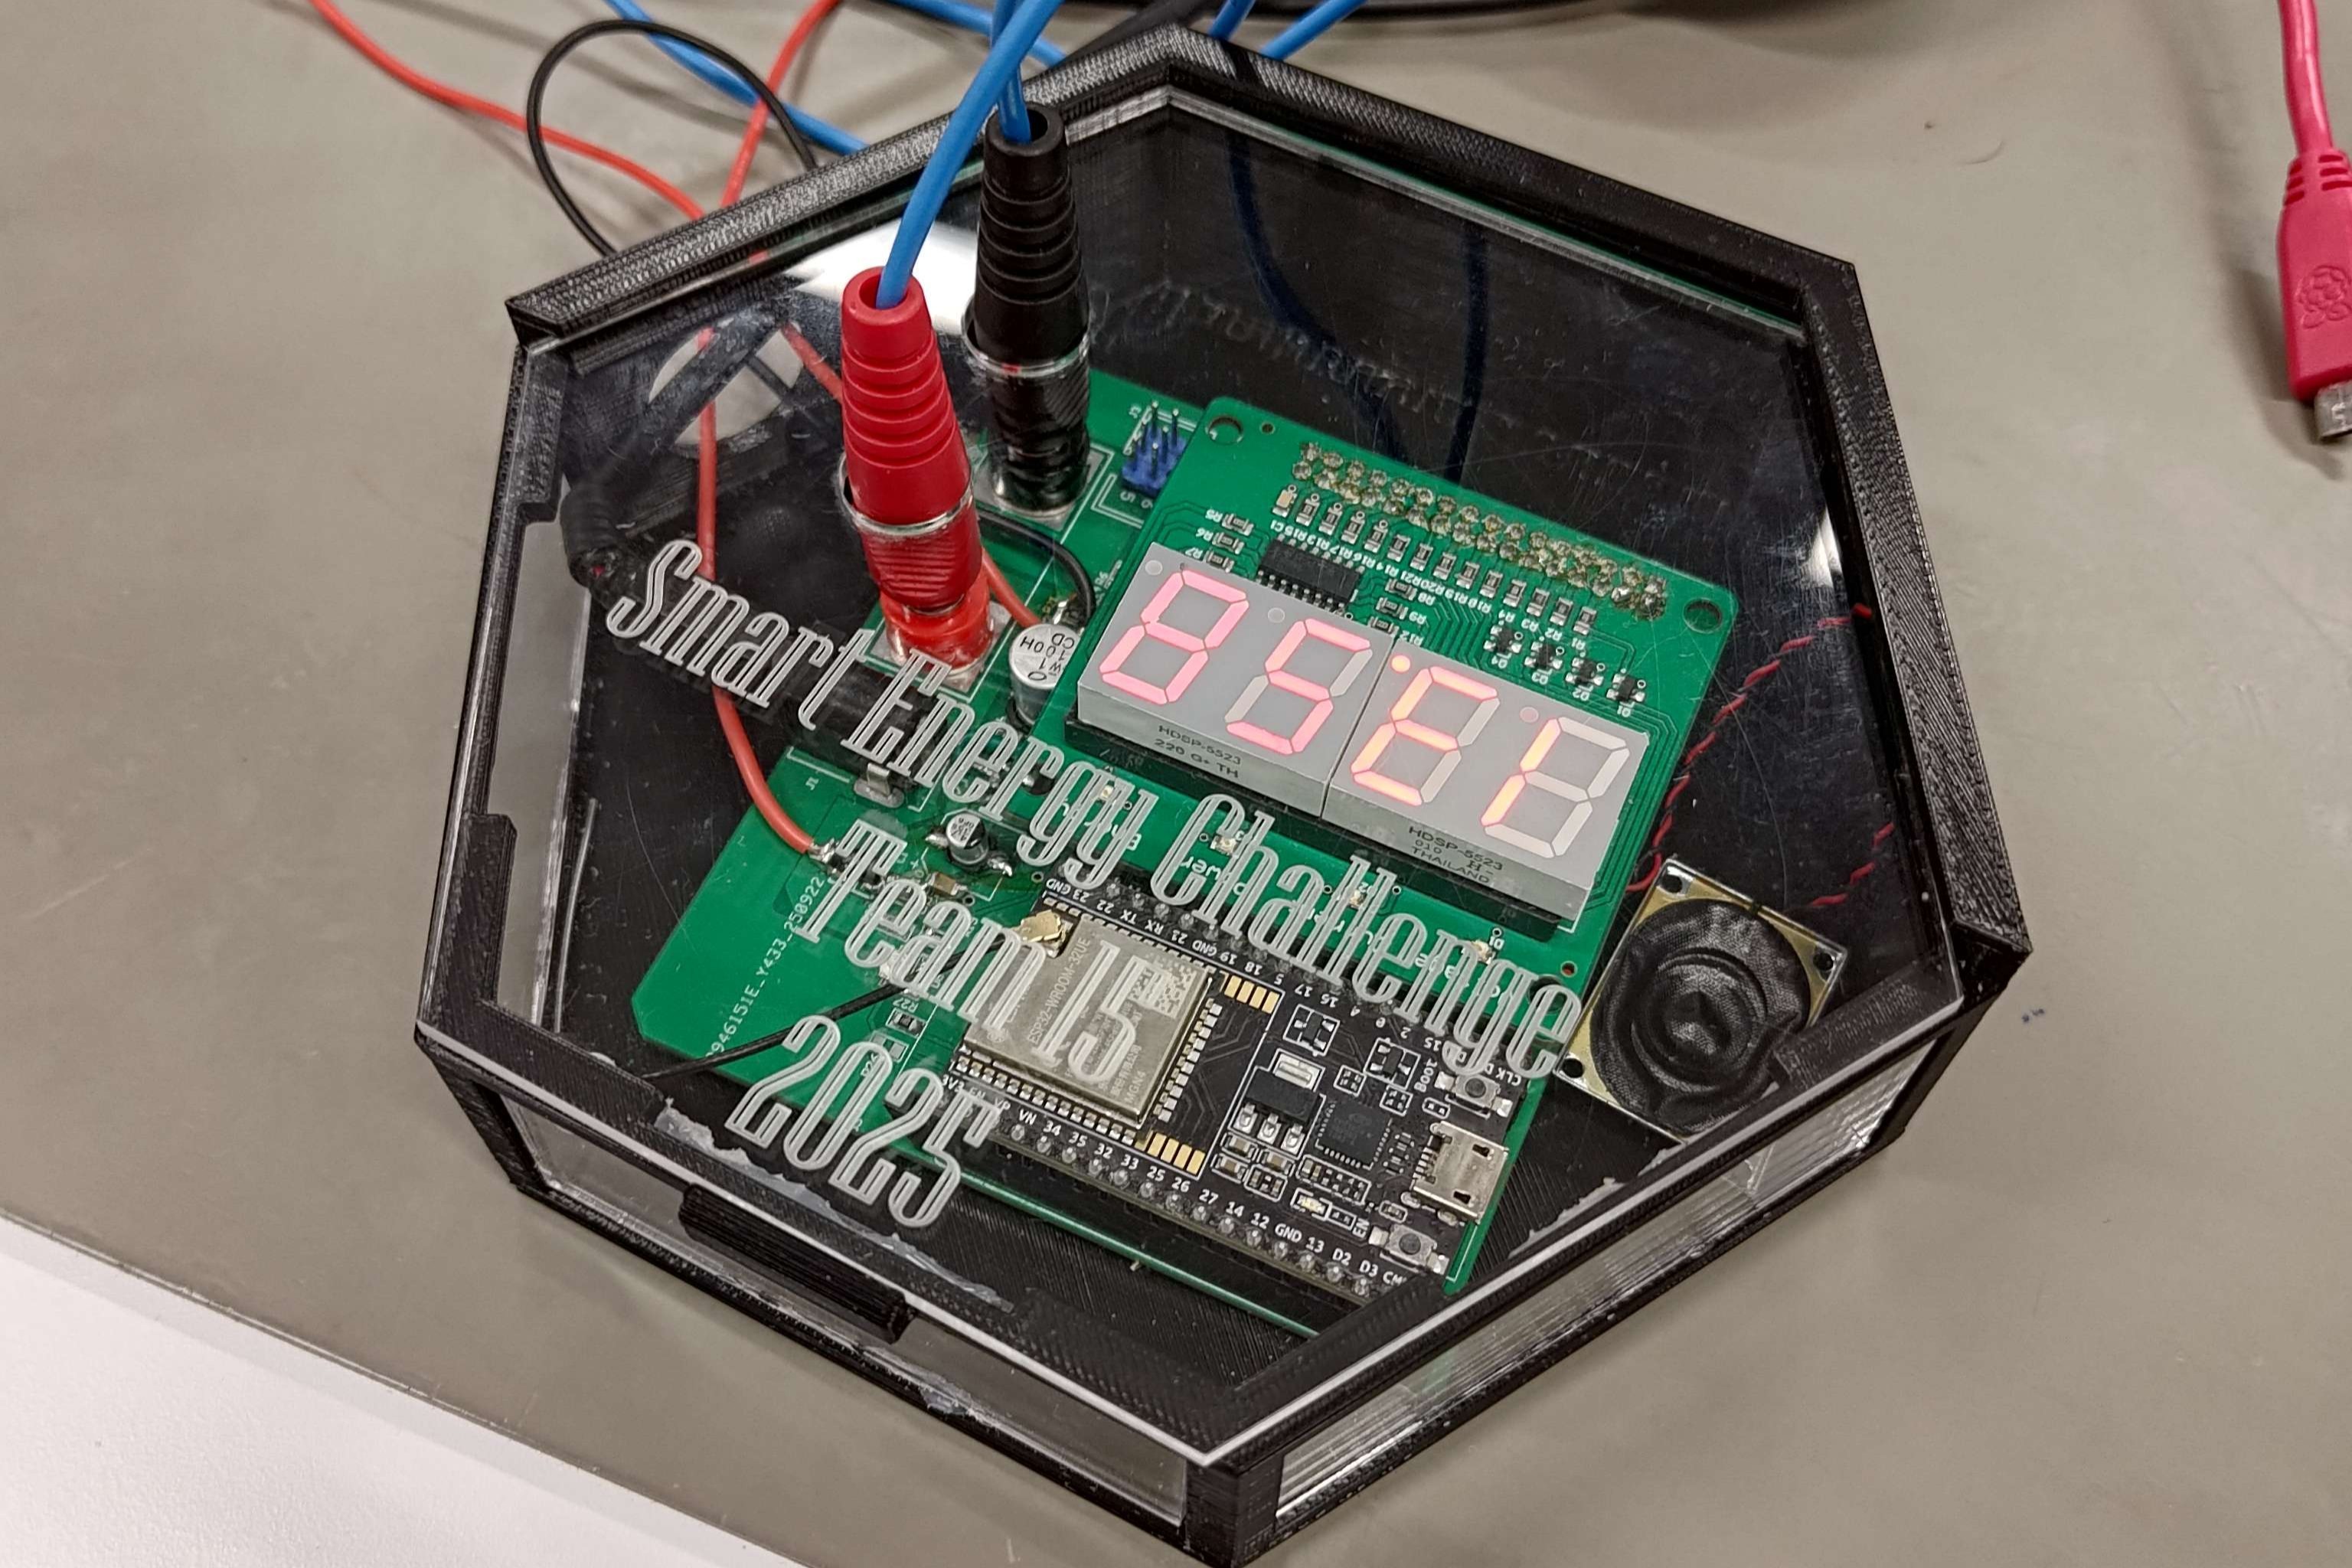
We also had a 7 segment display that we needed to use, this needed to be updated frequently as the segments
were all connected together and were switched between, so we could actually only have one digit on at a time.
since the ATMega is a single cored processor and we needed to balance a lot of different processes, we ended
up only having the display on for a bit, sampling and processing when it was off, this was not only due to
the limited processing power but also the regulator.
The Regulator
This was a pain in the ass. When I initially designed the schematic, I had designed a switchmode regulator
which we could have used in place of the recommended linear regulator that we were given. However one of the
TA's said that it was overkill and that we should simply use the provided regulator. If I knew how much
troubleshooting I would need to go through getting the linear regulator's feed resistor to not burn itself up,
I would have ignored his advice and gone ahead with my regulator design; but alas I listened to his advice and used the
recommended regulator. Turns out this regulator does not like a poorly rectified signal being put into it with
a tiny resistor, and when it did it produced a very very poor 5V, this caused the 2.1V reference voltage to be
NOT GOOD and would mess up our measurements. However under light loads, the poor regulation was not as apparent
and the 2.1V was ok. This lead to the decision to turn off the display while sampling, which meant the only part
really drawing any power was the ATMega, this didn't cause the 5V to sag and got us decently accurate results.
In the future I will be using a switchmode, or a better design for the regulator (the whole class also had the
same regulator issues :( ).
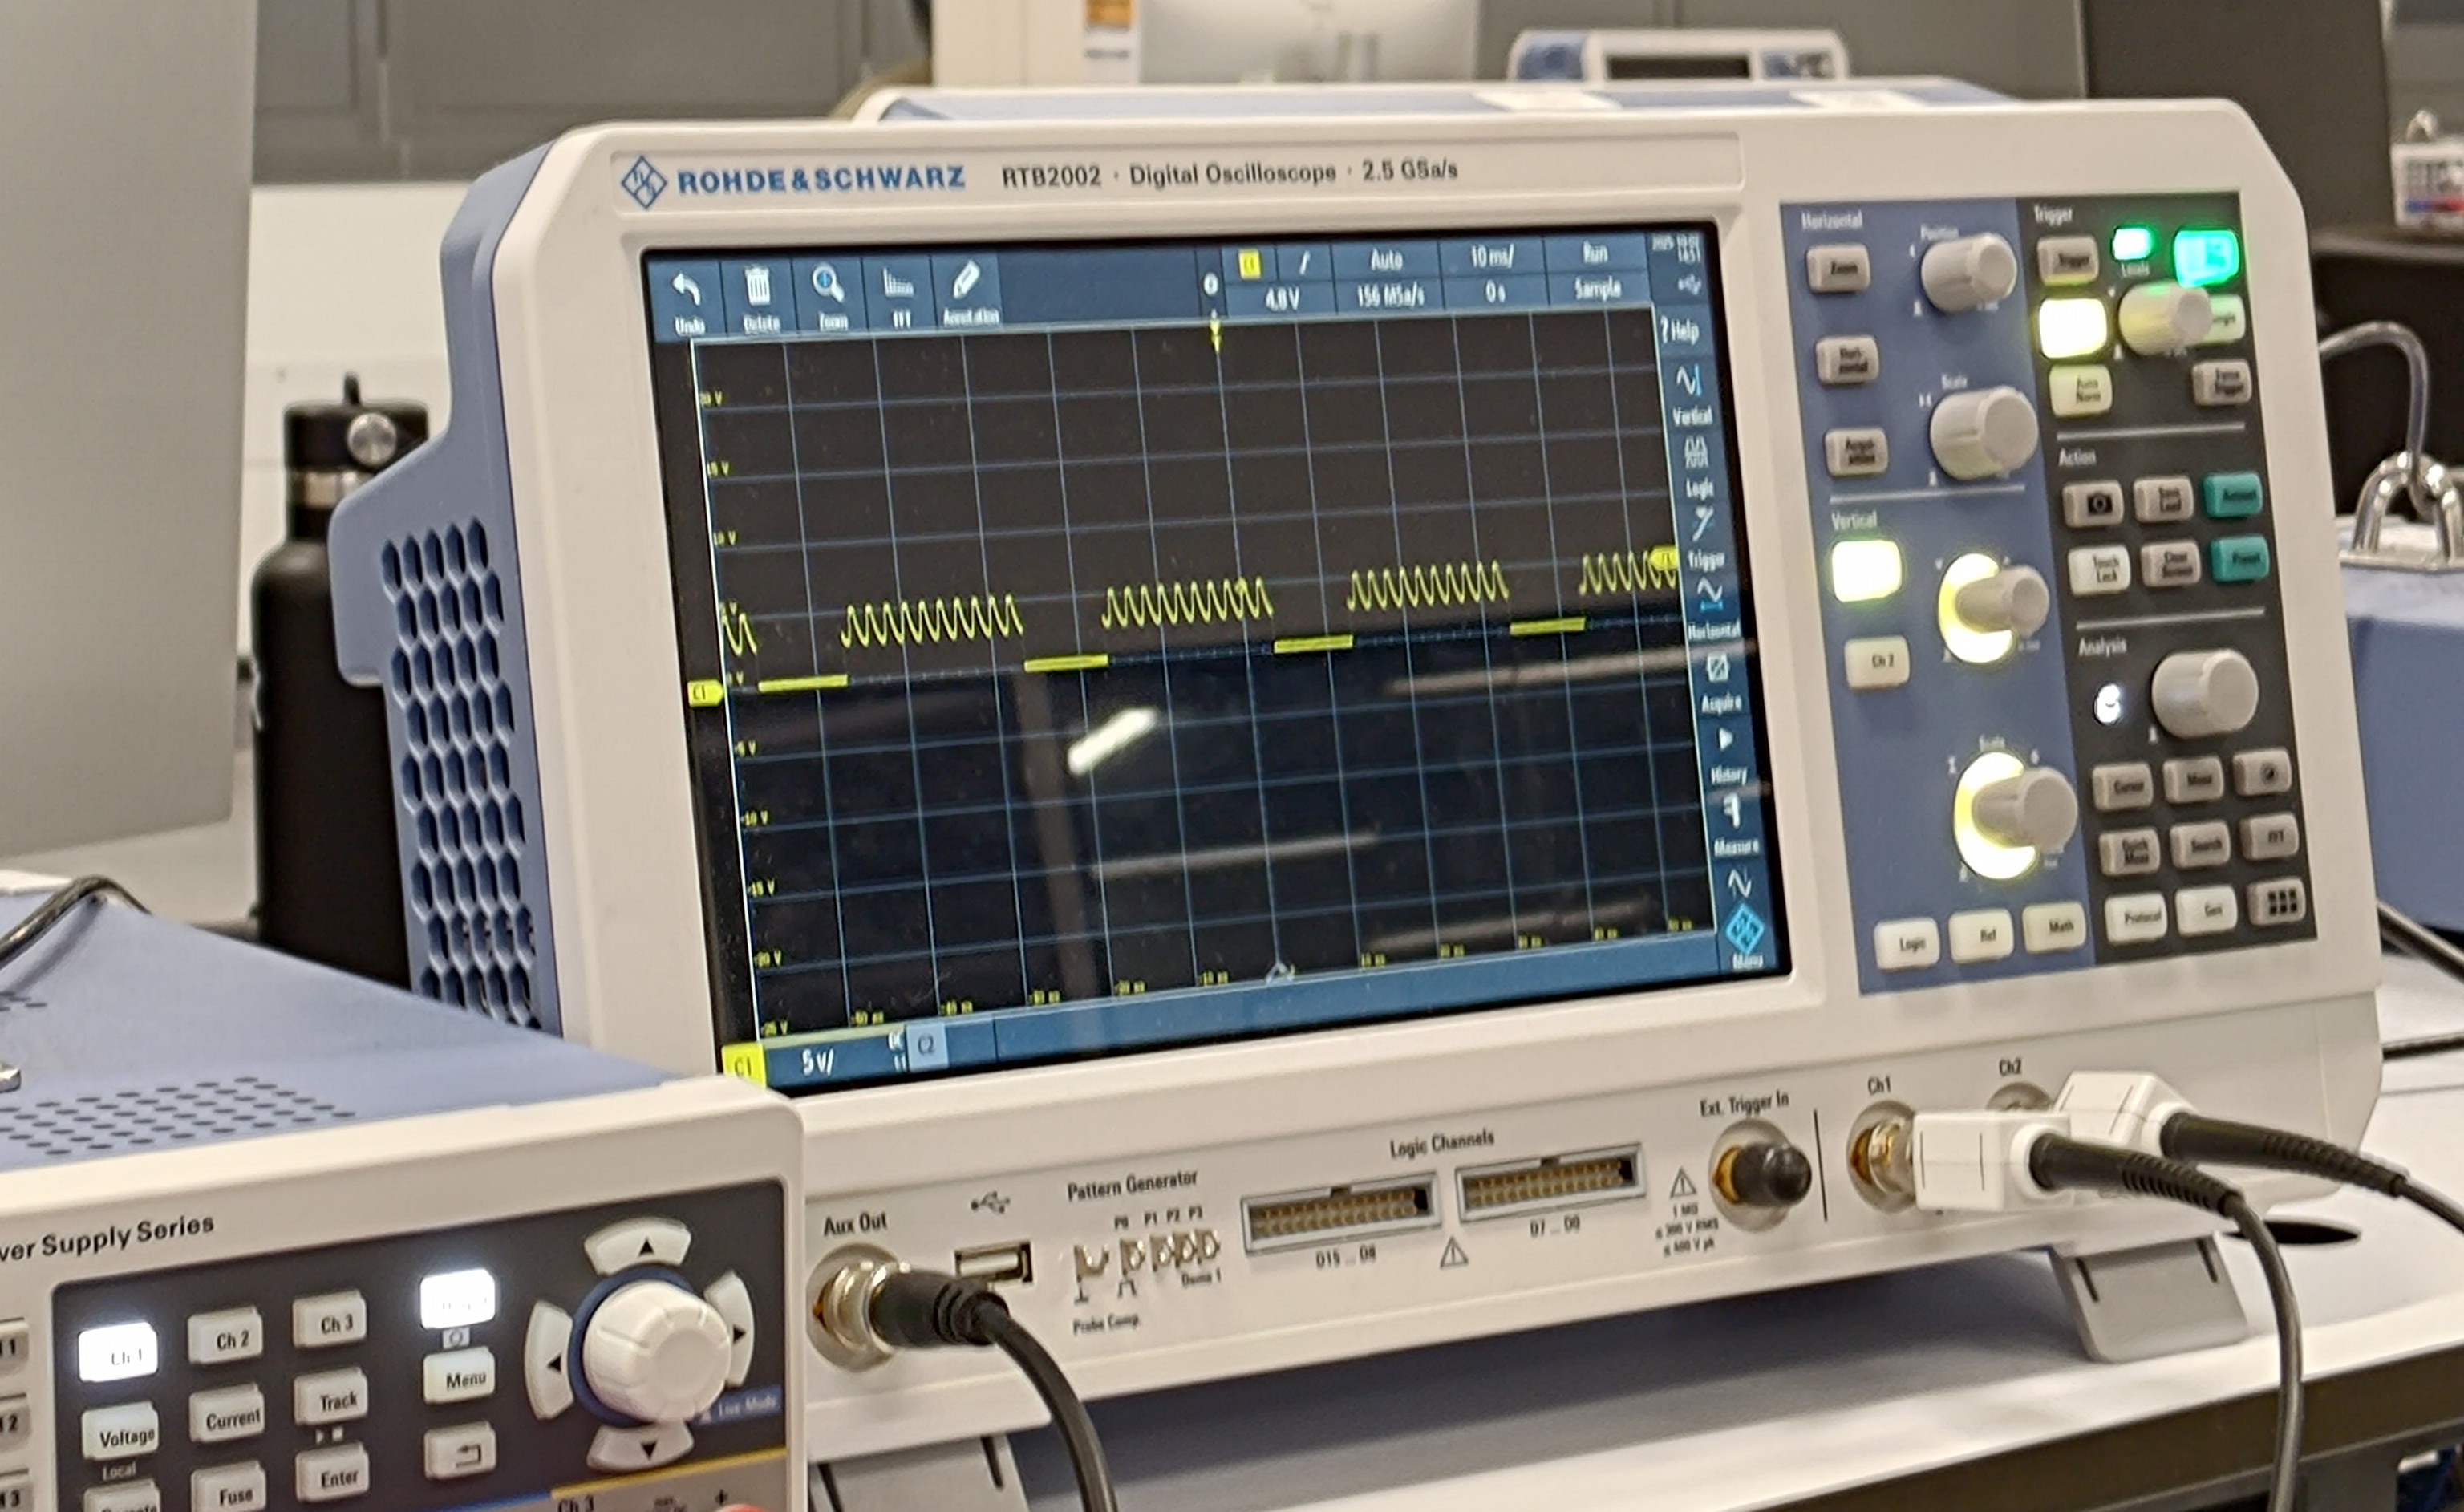
voltage ACROSS the resistor, This should be zero (it was not), the dips to zero is when the display is off.
Software
This was where I spent most of my time, the code needed to run fast on the hardware so the screen was not blank for too long while retaining the accuracy we gained by turning the display off. The code was written in C, where only the standard libraries would be used. For sampling the micro switches between the voltage and current adc channels rapidly, getting a total of 20 samples per channel. This was enough to make a good enough waveform, which we then could use to calculate the RMS Voltage, Instantaneous Current and Power. once we calculate all of these, the micro then would turn on the display and scroll through all the calculated values. This worked great and with just a little bit of calibration, got us a pretty accurate reading. additionally we decided to enter the smart energy challenge, so we needed to implement a website that would show the readings on a mobile phone or laptop. I also thought it would be cool if it could talk, so that was added along with the WiFi capability.
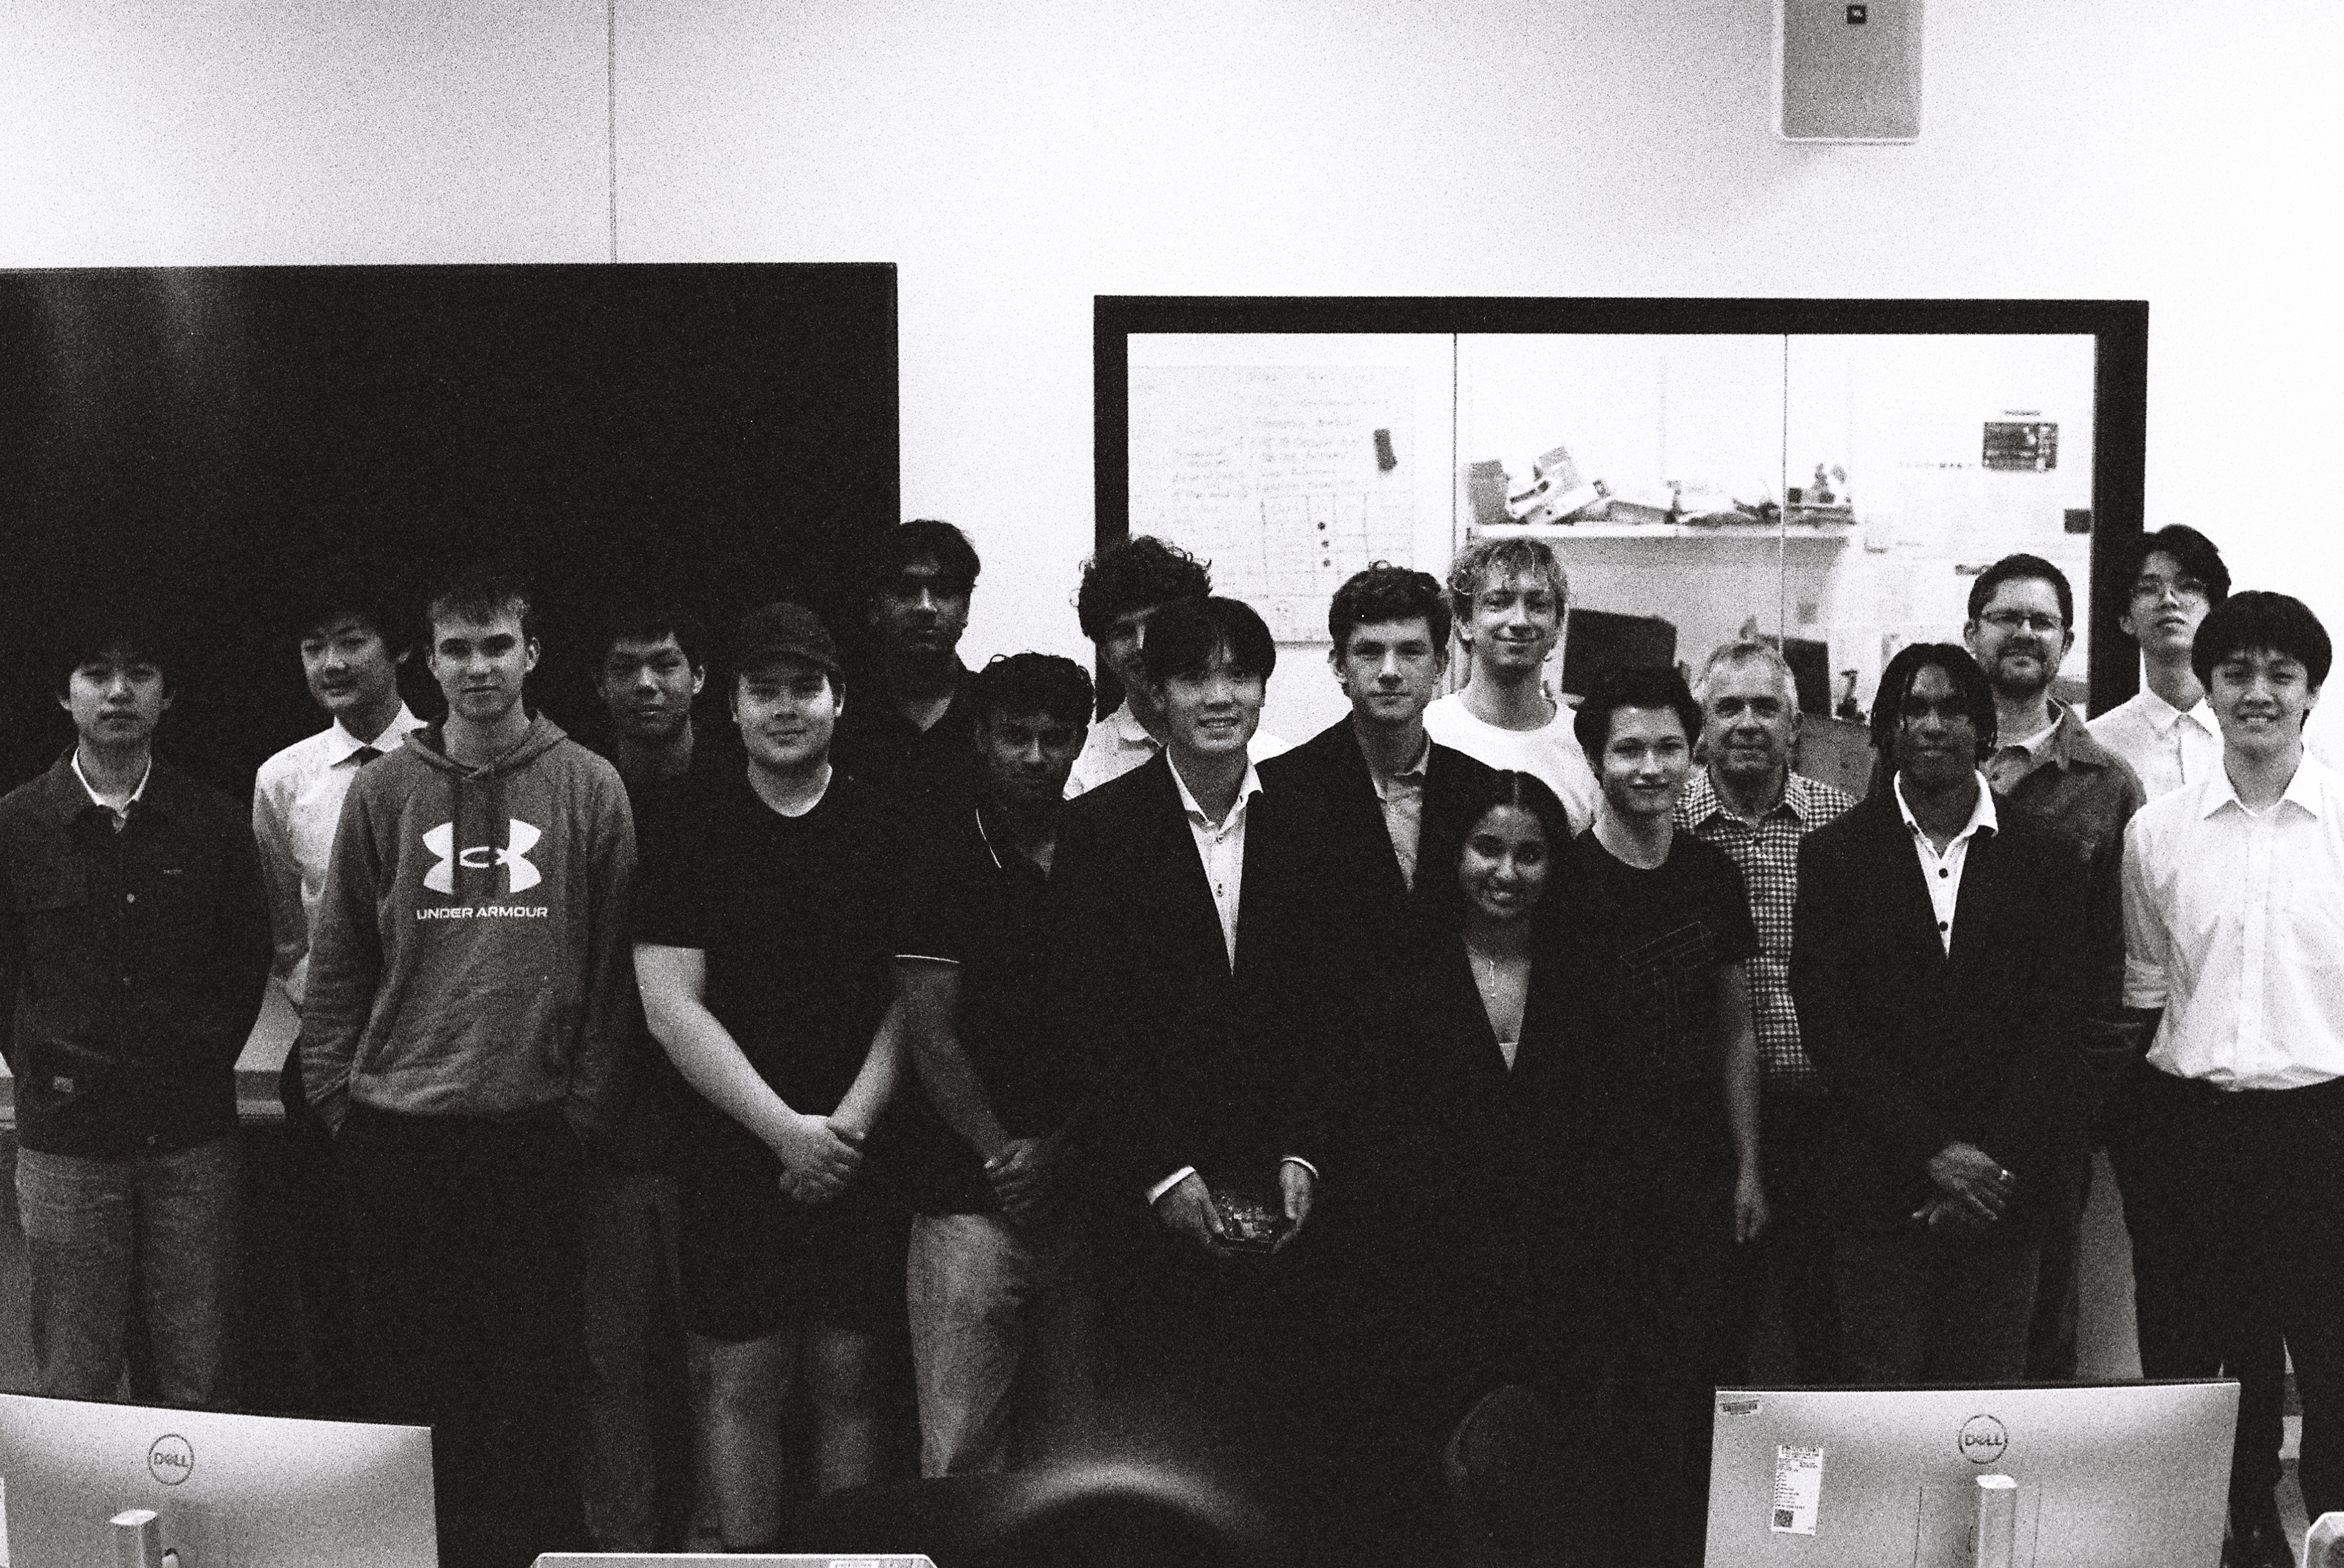
Showcase Time!
My team (along with 3 other teams) was chosen to present to DataMars, with one winning team chosen at the end.
The judges were impressed by its ability to say the readings out. We didn't come first (that went to my friends
Taine, Jasper, Mihir and Joel) But I was still very proud of my team and was grateful to have them working
with me.
Below are some photos of our project and my team